Did the AI Actually Work?
Everyone walks into AI expecting 10x. We built the boring thing instead: a measurement system nobody could argue with.
Everyone expects 10x
Watch an AI write code and 10x feels inevitable. Agents produce code faster than any human ever will, the weekend prototype looks finished, and somewhere in the building a leader is already predicting the product is done.
Then the real measurements come in. Opsera's 2026 benchmark of more than 250,000 developers found AI cuts time-to-pull-request by up to 58 percent, while those AI-generated pull requests wait 4.6 times longer in code review and carry 15 to 18 percent more security vulnerabilities. The code got faster. The verification got jammed.
Meanwhile the most careful measurers in the field showed what honesty looks like. METR, whose randomized trial famously caught developers believing AI made them 20 percent faster while the clock measured them slower, announced in February 2026 that its newer data was too unreliable to call either way. They said that out loud instead of publishing a headline number. That refusal is the discipline this whole story is about.
The gap between the prototype and production is where AI programs die. A demo is a time slice. Real measurement follows the work through the whole lifecycle, from code generation to production, and shows where items get stuck. So we refused to guess. We built a system to see it.
Raw data is not the truth
A measurement you adjust after seeing the results is not a measurement. It is a negotiation.
The metrics that worked before AI still work with AI. We kept the rule simple and locked it before reading any outcomes: throughput of completed stories, the same rule for every team, before AI and after. We looked at counting bugs and defects too, and dropped it; that argument never ends. Any metric will get gamed. A simple one gets gamed less.
Then we added the context, because raw data alone lies. We filtered out the noise so a small team's odd quarter could not pass as a trend. And we sat with each team's manager to get the story behind the data, because a dashboard cannot tell you the type of work changed, whether the project was greenfield or brownfield, who was out on vacation, or whether the team spent the quarter on tech debt.
What the dashboards actually said
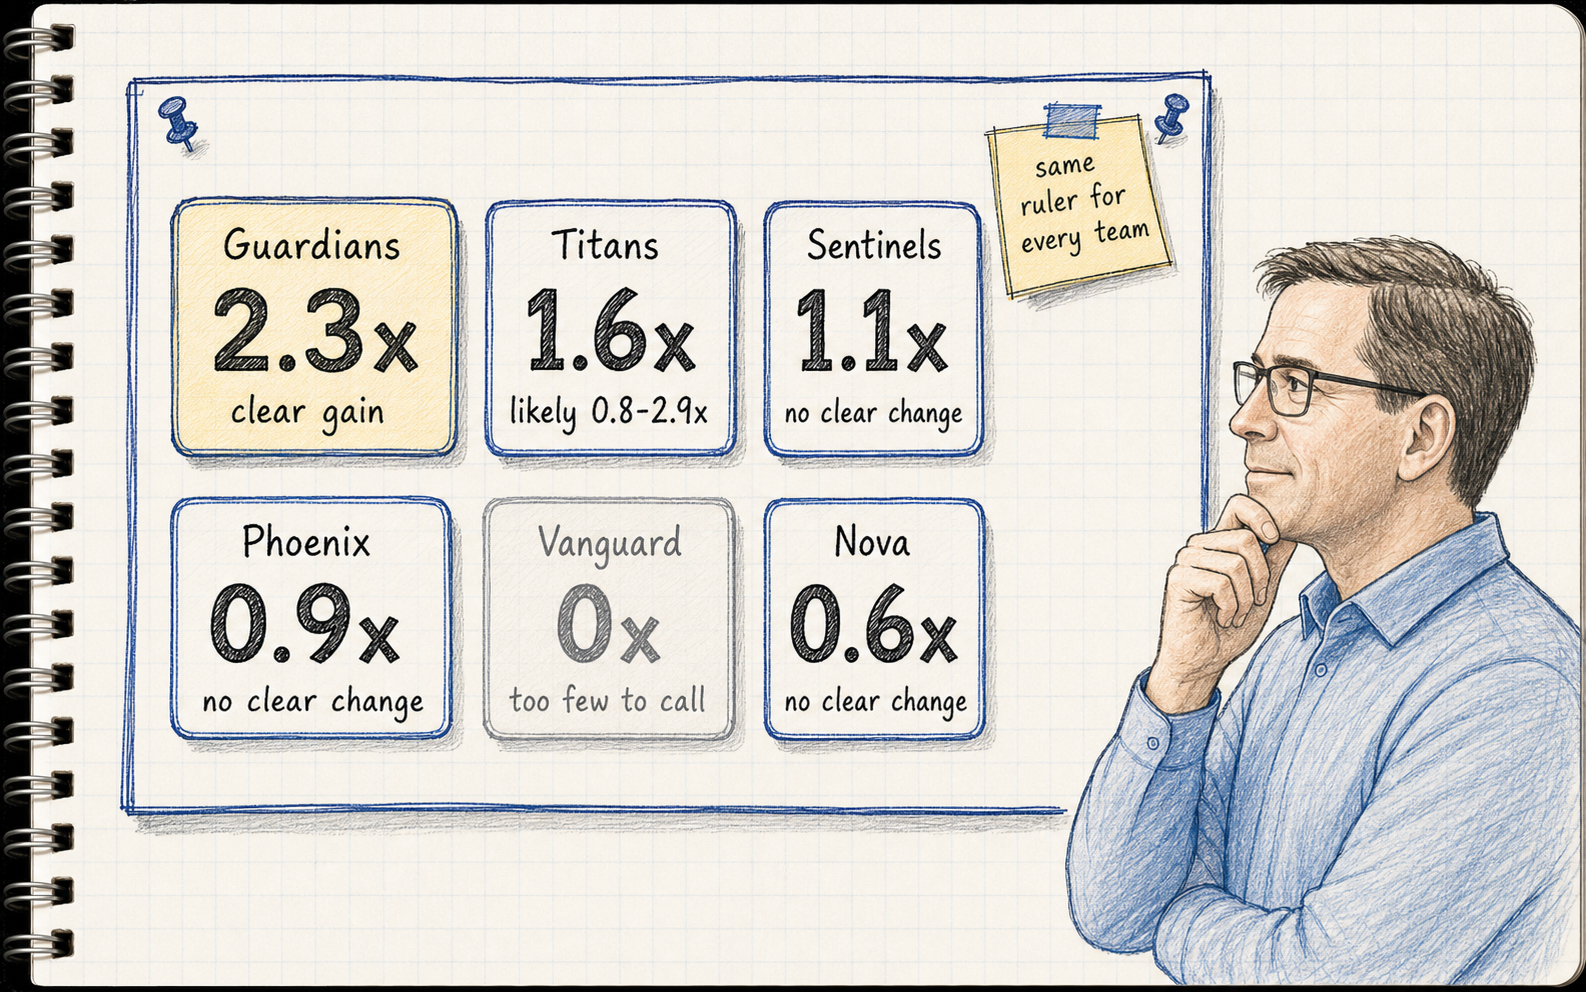
Twelve teams, one system. A few teams genuinely took off, with numbers you could defend in front of anyone. The middle of the pack improved modestly and honestly, and the middle is where you prove it. Every team was also on its own AI learning curve, so we factored that in. Some numbers dropped during the rollout. You cannot assess AI's impact while a team is unstable or its work is changing underneath it: a quarter of tech debt looks nothing like a greenfield build full of spikes and learning. Same rules, both directions: if a staffing dip is not AI's fault, a staffing surge is not AI's win.
The early numbers came in on the easy work, and throughput looked great. A larger sample told the real story. When the full lifecycle settled, the number came in lower, so we reported the lower number. The rocket ship stopped being 10x, and that single choice bought more credibility than any headline number ever could.
The bottleneck didn't disappear. It got bigger.
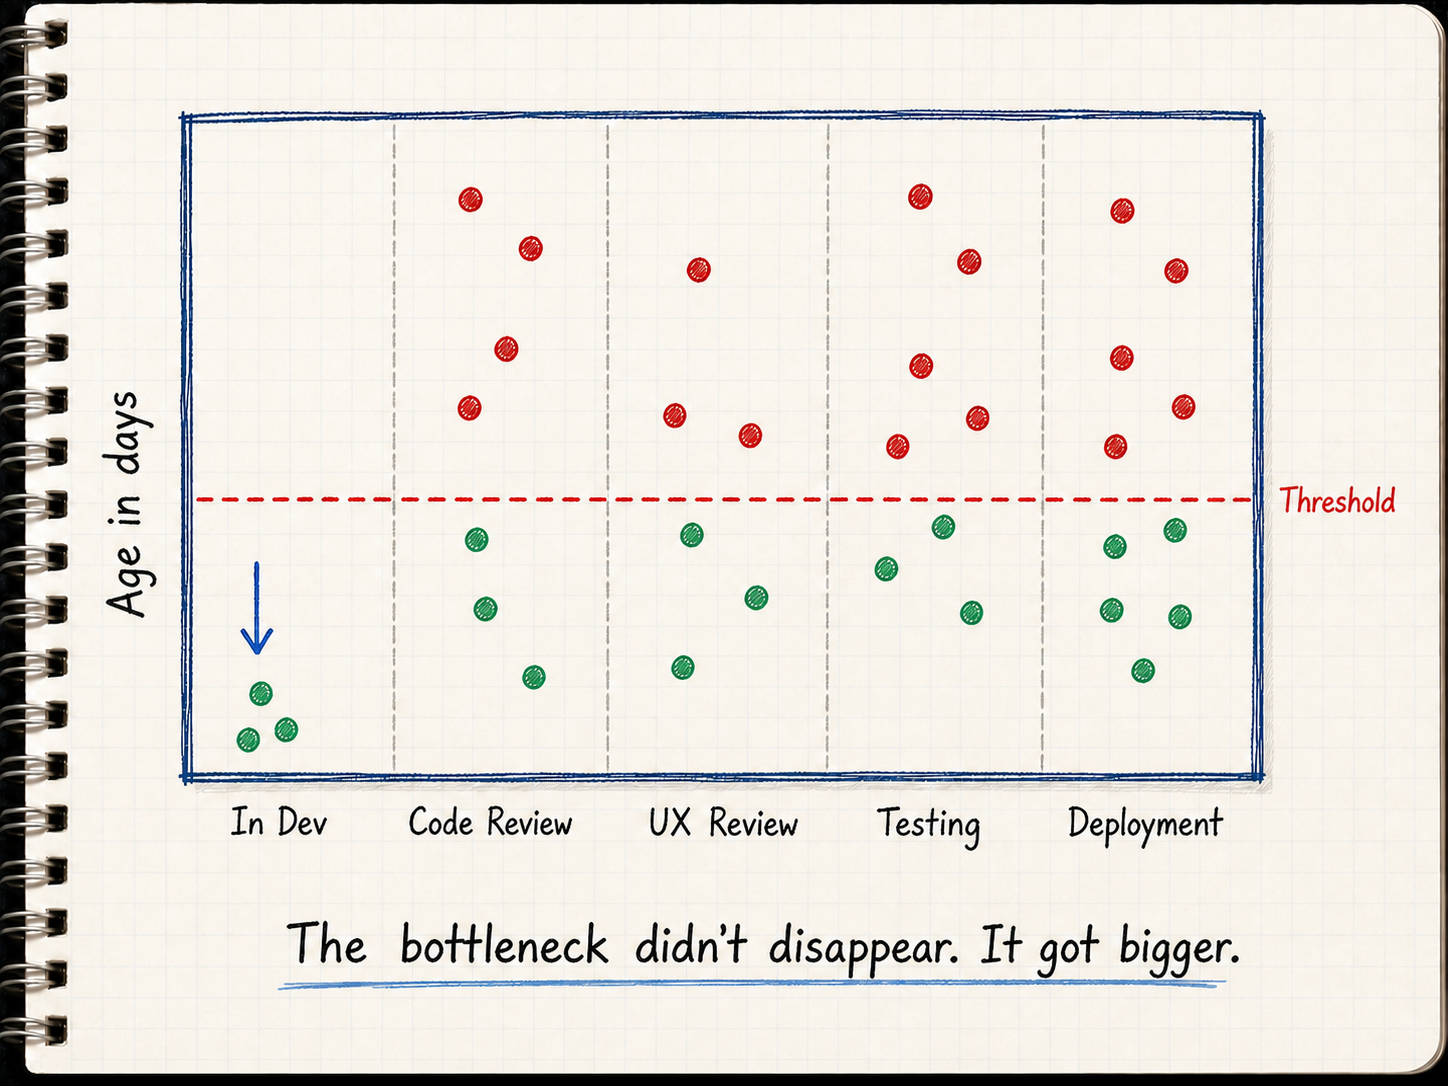
Then we looked at time-in-status, and the real story showed up. Coding time fell almost everywhere. The bottlenecks did not move an inch: work piled up in code review, UX review, testing, and deployment, exactly where it piled up before AI.
The aging charts made it impossible to argue with: dots stacking higher and turning red in every column where a human still has to look at the work. AI made code cheap. It made verification the constraint.
The playbook when the bottleneck gets bigger
Finding the constraint is half the job. Here is the playbook I run against it:
Release agents that do the deep code research. Before a release, AI agents trace every dependency across the other code repositories and green-light what is actually safe to ship, instead of a human spending days hunting for what might break.
Design clickable prototypes, not static mockups. A clickable prototype tests several variants and shows the real interaction; a static Figma file cannot. Built on a design system, the prototype transports straight back into Claude Code, and "just change the button" stops being a two-day ping-pong match between groups.
AI review before human review. Claude and other models pre-review the code: the lint, the obvious misses, the convention drift. The human reviewer spends their attention on judgment, which is the part only they can do.
Every fix aims at one target: make verification move at the speed code now moves.
What's old is new again
Every technology shift asks for the same discipline, and AI is no different. Honest measurement lets you make the right decisions and work the challenges that actually improve things. Because the numbers survived scrutiny, the conversation moved from "is AI working?" to "where do we break down the bottlenecks?" That is what a system built on real data gets you: focus on the things that actually change outcomes.
Expecting 10x? Getting there means going beyond the dashboard number: into your system, the root causes, and the real opportunities. That is where I work, and where I live.
Email me →